Jordan – U.S. Economic Relations Profile
Jordan and the U.S. established diplomatic relations on January 31st 1949 and since then they have enjoyed a dynamic economic relationship characterized by continuous cooperation and groundbreaking achievements.
The Jordan–U.S. partnership for economic development began in 1952 through President Truman’s Point IV Program, that later became the U.S. Agency for International Development (USAID). USAID has partnered with Jordan on a wide range of projects in areas of economic development, water conservation, healthcare, education and training, and governance.
As the Jordanian economy continued to grow, the Jordan–U.S. economic partnership developed stronger ties. The 1990s witnessed the signing of a number of economic agreements between Jordan and the U.S., pioneering with the Jordan–U.S. Bilateral Commission, which held its first meeting in 1994 to improve trade between both countries.
In 1996, the U.S. Congress established Qualifying Industrial Zones (QIZs) with Jordan the QIZ arrangement grants products of the QIZs duty- and quota-free access to American markets and had an important effect in stimulating trade growth between the two countries.
Jordan–U.S. signed a Bilateral Investment Treaty (BIT) in 1997 that entered into force in 2003.

The economic relations were crowned, in 2000, with the signing of the Jordan–U.S. Free Trade Agreement (JUSFTA), that is designed to lead to the total liberalization of trade in goods and services between the two trading partners by removal of virtually all tariffs on bilateral trade in goods by the end of 2010.
Trade and investment play a critical role in the Jordan – U.S. relations. Jordan has successfully attracted U.S. businesses. Jordan-U.S. trade has grown exponentially from 2001 to 2016, surging by more than 800 percent. U.S. Investments in Jordan are valued at 10% of the total FDI, with companies such as Cargill, Amazon Web Services, Microsoft, Cisco, Sun Edison, First Solar, and AES.
Jordan is also eligible to benefit from the U.S. General System of Presences (GSP)
Trade
The JUSFTA came into effect on 17 December, 2001 and the target of reducing tariffs in all areas except those exempt to 0% have been met.
Jordanian exports to the U.S. market are mainly in Textiles and clothing, chemical fertilizers, pharmaceutical products, articles of jewelry, phosphates and insecticides. The main Jordanian imports from the US market in the JUSFTA period have remained the same as in the pre-JUSFTA period, but have witnessed rapid growth in the quantity and value of sales. The leading imports are in the following areas: vehicles, cereals (wheat, rice and corn), machinery and aircraft.
Trade Balance
| Jordan – US Trade in Goods Value | |||
| Year | Imports | Exports | Balance |
| 1999 | 275.7 | 30.7 | -245 |
| 2000 | 316.9 | 73.3 | -243.6 |
| 2001 | 339 | 229.2 | -109.8 |
| 2002 | 404.4 | 412.4 | 8 |
| 2003 | 492.4 | 673.5 | 181 |
| 2004 | 551.5 | 1,093.40 | 541.9 |
| 2005 | 644.2 | 1,266.80 | 622.7 |
| 2006 | 650.3 | 1,422.10 | 771.7 |
| 2007 | 856.2 | 1,328.90 | 472.7 |
| 2008 | 940.3 | 1,137.50 | 197.1 |
| 2009 | 1,191.80 | 924.1 | -267.7 |
| 2010 | 1,172.20 | 974.1 | -198.1 |
| 2011 | 1,449.70 | 1,060.50 | -389.2 |
| 2012 | 1,766.40 | 1,155.50 | -610.8 |
| 2013 | 2,085.00 | 1,197.30 | -887.8 |
| 2014 | 2,050.10 | 1,401.30 | -648.8 |
| 2015 | 1,359.60 | 1,491.60 | -132 |
| 2016 | 1,459.00 | 1,554.70 | -95.8 |
| 2017 | 1,920.70 | 1,687.00 | -233.7 |
| 2018 | 1,581.40 | 1,813.70 | 232.3 |
| 2019 | 1,492.70 | 2,169.80 | 677.2 |
Sources: US Census Bureau, https://www.census.gov/foreign-trade/balance/c5110.html
Exports and Imports in Details
Jordan’s Export to the U.S.
| Indicator Export (US$ Thousand) | ||||||||
| Product Group | 2011 | 2012 | 2013 | 2014 | 2015 | 2016 | 2017 | 2018 |
| All Products | 1,040,465 | 1,125,340 | 1,205,678 | 1,323,267 | 1,445,605 | 1,558,303 | 1,603,242 | 1,768,378 |
| Capital goods | 7,690 | 8,704 | 11,379 | 10,231 | 15,425 | 19,293 | 20,904 | 35,343 |
| Consumer goods | 1,026,203 | 1,102,424 | 1,186,227 | 1,304,678 | 1,400,864 | 1,448,048 | 1,548,976 | 1,696,519 |
| Intermediate goods | 4,806 | 10,571 | 5,532 | 2,195 | 24,075 | 86,475 | 30,056 | 33,299 |
| Raw materials | 840 | 2,180 | 1,392 | 1,208 | 2,649 | 2,589 | 2,655 | 1,999 |
| Animal | 469 | 1,313 | 1,123 | 735 | 1,602 | 1,725 | 972 | 1,581 |
| Chemicals | 29,741 | 27,316 | 22,022 | 21,308 | 28,642 | 40,514 | 36,716 | 44,805 |
| Food Products | 6,484 | 7,563 | 10,421 | 13,150 | 11,112 | 12,511 | 11,797 | 9,752 |
| Footwear | – | – | – | 5 | 5 | 5 | 2 | |
| Fuels | 16 | 11 | 98 | 18 | 79 | 22 | ||
| Hides and Skins | 64 | 10 | 7 | 23 | 19 | 10 | 12 | 26 |
| Mach and Elec | 6,701 | 6,565 | 11,477 | 8,896 | 14,180 | 17,947 | 19,813 | 33,567 |
| Metals | 1,038 | 1,863 | 839 | 157 | 704 | 1,719 | 1,776 | 2,896 |
| Minerals | 23 | 58 | 2 | 168 | 39 | 143 | 13 | |
| Miscellaneous | 2,061 | 3,648 | 1,739 | 7,075 | 4,596 | 3,561 | 2,300 | 2,777 |
| Plastic or Rubber | 1,276 | 1,924 | 1,230 | 1,197 | 1,987 | 1,574 | 1,004 | 988 |
| Stone and Glass | 53,208 | 60,751 | 70,085 | 89,957 | 101,362 | 119,721 | 124,685 | 106,173 |
| Textiles and Clothing | 936,299 | 1,003,178 | 1,084,248 | 1,177,068 | 1,251,995 | 1,267,332 | 1,366,738 | 1,526,414 |
| Transportation | 1,445 | 8,135 | 475 | 706 | 24,318 | 87,014 | 32,596 | 34,842 |
| Vegetable | 1,267 | 1,630 | 1,580 | 2,505 | 4,735 | 4,371 | 4,470 | 4,485 |
| Wood | 390 | 1,371 | 419 | 315 | 213 | 138 | 271 | 47 |
Sources: http://wits.worldbank.org
Jordan’s Import from the U.S.
| Indicator Import (US$ Thousand) | ||||||||
| Product Group | 2011 | 2012 | 2013 | 2014 | 2015 | 2016 | 2017 | 2018 |
| All Products | 1,077,560 | 1,384,679 | 1,361,122 | 1,319,844 | 1,260,084 | 1,341,213 | 2,000,351 | 1,764,189 |
| Capital goods | 286,116 | 246,347 | 296,330 | 347,542 | 410,009 | 367,612 | 674,712 | 283,335 |
| Consumer goods | 372,724 | 674,741 | 684,335 | 511,076 | 473,324 | 543,035 | 799,666 | 1,031,197 |
| Intermediate goods | 213,872 | 258,582 | 177,297 | 226,154 | 169,371 | 228,091 | 252,305 | 243,993 |
| Raw materials | 121,354 | 125,830 | 108,644 | 96,566 | 93,539 | 114,457 | 162,217 | 85,931 |
| Animal | 34,178 | 36,424 | 58,203 | 54,627 | 28,031 | 18,630 | 24,160 | 18,069 |
| Chemicals | 100,207 | 91,064 | 89,806 | 92,894 | 103,733 | 118,755 | 119,189 | 122,269 |
| Food Products | 28,679 | 37,554 | 40,269 | 41,577 | 43,637 | 46,431 | 46,831 | 43,739 |
| Footwear | 698 | 2,862 | 2,109 | 2,154 | 2,970 | 4,657 | 771 | 514 |
| Fuels | 71,297 | 346,301 | 251,505 | 12,338 | 8,690 | 76,737 | 182,309 | 551,381 |
| Hides and Skins | 478 | 580 | 626 | 612 | 174 | 197 | 259 | 167 |
| Mach and Elec | 220,366 | 155,144 | 173,938 | 220,026 | 287,869 | 250,896 | 565,995 | 176,059 |
| Metals | 74,049 | 66,224 | 48,213 | 32,442 | 24,430 | 21,707 | 16,988 | 14,386 |
| Minerals | 1,783 | 2,337 | 2,954 | 2,090 | 2,845 | 1,605 | 2,027 | 1,902 |
| Miscellaneous | 151,828 | 158,268 | 170,930 | 229,159 | 205,408 | 172,252 | 201,932 | 215,915 |
| Plastic or Rubber | 30,704 | 43,170 | 32,549 | 28,102 | 23,131 | 24,130 | 23,653 | 20,499 |
| Stone and Glass | 4,653 | 4,038 | 13,557 | 18,902 | 12,381 | 4,226 | 4,031 | 3,997 |
| Textiles and Clothing | 12,792 | 15,017 | 21,780 | 18,736 | 19,715 | 17,242 | 14,511 | 9,356 |
| Transportation | 125,027 | 217,629 | 294,257 | 386,420 | 305,415 | 386,287 | 525,675 | 401,528 |
| Vegetable | 187,710 | 183,215 | 131,168 | 150,458 | 165,131 | 173,486 | 247,279 | 158,199 |
| Wood | 33,111 | 24,852 | 29,257 | 29,307 | 26,524 | 23,975 | 24,742 | 26,209 |
Sources: http://wits.worldbank.org
Trade in Services
Jordan also exports services to the U.S., with registered exports amounting to around $100 million dollars in 2013, in sectors such as IT, consulting, tourism as well as health services. It should be noted that the value of services trade is probably much higher. However, the lack of statistics makes any concrete estimate difficult to make.
Investment
A sizable percentage of value added – profit generating – investments in Jordan are American, amounting to $2.2 billion dollars representing 10% of total foreign direct investment. A number of global American companies such as AES, Albamar, Cargel, Pepsi and Coca-Cola have made Jordan their home. Equally, Jordanian Companies, specifically in the IT sector, are setting up in the U.S.
U.S. Investments in Jordan
Detailed data on the value and type of U.S. FDI in Jordan is limited. AmCham –Jordan undertook a review of statistical data obtained from the Companies Control Department (CCD) website for all types of companies to exclude public shareholding companies. For investments in the capital market (stocks and Securities), the consultant relied on the statistical data obtained from the Security Depository Center.
This section below provides the results of this review that reflects actual U.S. investments in Jordan by sector for the period 1998-2006 using ISIC 4 Classification, as well as review U.S. investments in the Jordan Capital Market (Stocks & Securities) for the period 2005-2016.
Actual U.S. Investments by Sector (1998-2016)
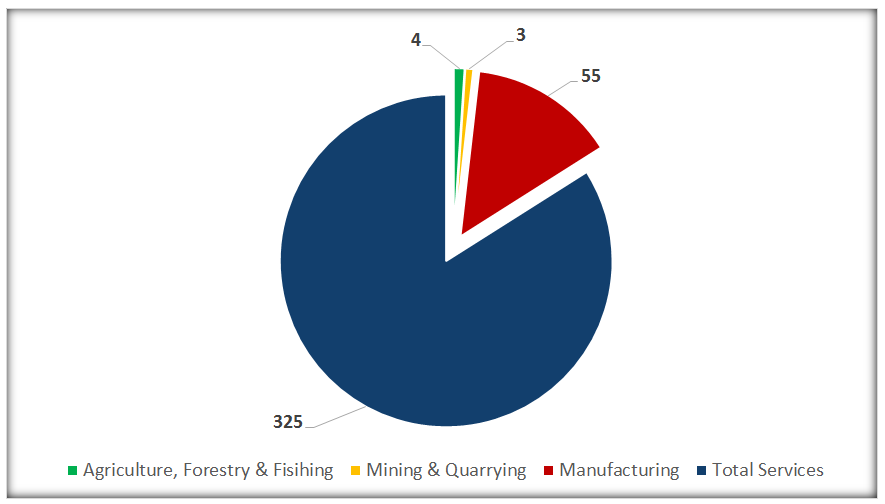
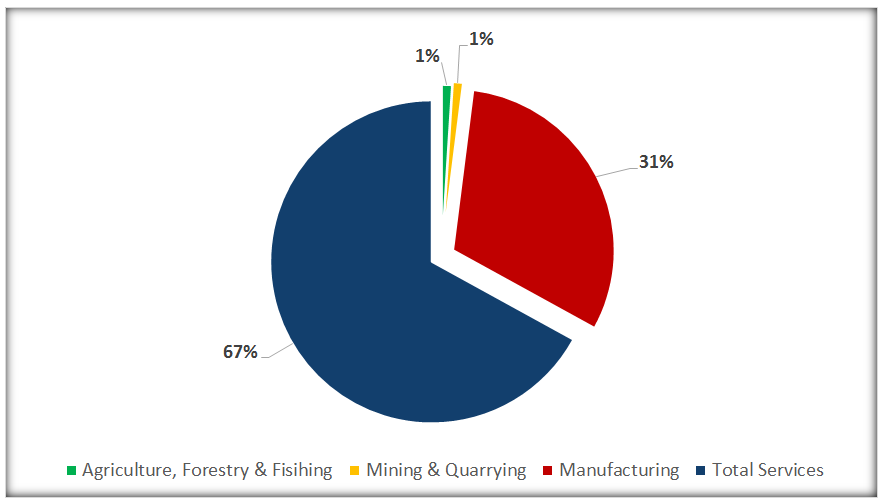
The value of registered capital by U.S. nationals in Jordanian companies – to exclude public shareholding companies- has reached JD 40.68 million, invested in 387 companies for the period 1998-2016[1]. As shown in figure 1, the manufacturing sector claimed nearly 31 percent of total investments by U.S. nationals. Investments in the mining sector and the agricultural sectors were minimal, while the combined investments in the services sector accounted for 67 percent of total US registered capital in Jordanian Companies.
By looking further into the number of companies, U.S .ownership of Jordanian companies were mostly undertaken in the services sector (325 companies) followed by manufacturing (55 companies) (figure 1).
Figure 1-Breakdown of the value of U.S. Registered Capital by sector (%), and by number of companies per sector (1998-2006)
Sources: Companies Control Department
Summary table of U.S. Investments in Jordan
| Values | ||||
| ISIC Category 2 | ISIC Category | Sum of Registered Capital | Sum of US Capital | Count of Registered Capital2 |
| A | 250,000 | 250,000 | 4 | |
| A | 250,000 | 250,000 | 4 | |
| B | 1,100,000 | 610,000 | 3 | |
| B | 1,100,000 | 610,000 | 3 | |
| C | 25,095,050 | 12,419,698 | 55 | |
| C | 25,095,050 | 12,419,698 | 55 | |
| Services | 213,177,200 | 27,404,102 | 325 | |
| D | 637,667 | 379,220 | 8 | |
| E | 3,600,000 | 1,800,000 | 3 | |
| F | 4,682,500 | 3,348,507 | 53 | |
| G | 10,555,112 | 4,261,342 | 85 | |
| H | 1,930,000 | 587,400 | 10 | |
| I | 53,751,000 | 2,271,900 | 19 | |
| J | 12,787,800 | 4,801,821 | 26 | |
| K | 9,017,110 | 4,088,506 | 15 | |
| L | 74,445,101 | 3,214,998 | 53 | |
| M | 1,008,000 | 707,180 | 17 | |
| N | 350,000 | 150,000 | 3 | |
| P | 39,077,460 | 1,049,624 | 18 | |
| Q | 440,450 | 225,000 | 4 | |
| R | 630,000 | 353,600 | 6 | |
| Grand Total | 239,622,250 | 40,683,800 | 387 | |
Sources: http://wits.worldbank.org
U.S. investments in the Jordanian Capital Market (stocks & securities)
U.S. investments in the Jordanian Capital market averaged JD 840.4 million per year for the period 2005-2016, accounting for only 0.3 percent of the average annual investment in the Jordanian Capital Market (figure 5). However, there are several companies in the financial services sector that were established as holding companies using US Corporate capital such as Al-Mutarabetah for Investments- a holding company with a total registered capital of JD 240,000.
This company managed to attract US corporate investors such as the American Life Insurance Company and Philips Electronics North America Corporation Master Retirement Trust. This company, for example, owns stocks in the Jordanian Capital market but their investments will only show as Jordanian not US investments since they were undertaken by a Jordanian company.
This illustrates that investments in the capital market could be enhanced by attracting US corporate capital to invest in Jordanian holding companies.
| Investments in the Jordan Capital Market by Nationality (Stocks & Bonds) 2005-2016 | ||||
| Year | American | Jordanian | Other | Total |
| 2005 | 478052710.7 | 15,319,931,622 | 10,772,594,131 | 26,570,578,464 |
| 2006 | 376256803.8 | 12,591,806,036 | 8,743,043,019 | 21,711,105,859 |
| 2007 | 997378396.9 | 15,988,465,296 | 12,645,340,624 | 29,631,184,316 |
| 2008 | 962876542.5 | 13,767,015,016 | 11,095,713,923 | 25,825,605,481 |
| 2009 | 971176678.3 | 12,485,768,799 | 9,472,013,614 | 22,928,959,092 |
| 2010 | 1146432916 | 11,931,360,184 | 9,048,854,407 | 22,126,647,508 |
| 2011 | 1171022087 | 10,468,843,967 | 8,093,522,016 | 19,733,388,070 |
| 2012 | 1235533492 | 10,300,226,952 | 8,059,409,723 | 19,595,170,166 |
| 2013 | 836905229 | 10,002,832,284 | 7,819,121,919 | 18,658,859,433 |
| 2014 | 640671216.4 | 9,993,608,442 | 7,826,824,486 | 18,461,104,145 |
| 2015 | 649081702.7 | 9,825,995,483 | 7,872,056,559 | 18,347,133,745 |
| 2016 | 619945624.9 | 9,267,967,366 | 7,796,772,743 | 17,684,685,734 |